I’ve been getting asked what I think will happen with the stock market in 2026. Trying to predict what will happen in the market is a lot like trying to predict how a chess match will unfold. There are an infinite number of possible outcomes, as one move can branch out and create many alternative chains of events. But with that said, there are a number of things that have a higher probability of occurring given what stock market history has taught us, and there are a number of events setting up today that have been played out before in the past that can give us clues as to how things could unfold this time as well.
The current average consensus target from Wall Street analysts is about a 10% advance in the S&P 500, to about 7,555. Earnings are expected to grow 13%-15% due to advances in productivity from AI, so on the surface, that kind of advance seems reasonable. However, those targets are based on some fragile assumptions, some of which I’ll discuss below.
Federal Reserve Policy: The Tail That Wags the Dog
The single most important lesson of the last few years is that the Federal Reserve’s interest rate policy and open market operations eventually overwhelms every other market variable.
We saw this clearly in 2020. In the first quarter of 2020, due to the panic shutdowns caused by Covid, economic figures and corporate earnings collapsed to the point that there was serious talk of a new Great Depression on the way.
The S&P 500 suffered a massive loss of -33.8% over just 22 trading days (about 33 calendar days), the fastest decline in US stock market history, rivaling even that of the 1929 crash, where it took 41 trading days to reach a 30% decline.
However, Federal Reserve policy saved the day. The Fed entered 2020 with the Fed Funds rate at 1.50% – 1.75%. In a matter of weeks, they slashed it to 0% – 0.25% and launched an unprecedented quantitative easing (QE) program that expanded the balance sheet by roughly $3 trillion in just three months (growing from about $4.2T to $7.2T). Despite the weak economic backdrop, the market rallied to end the year up +18.4%.
We saw the opposite happen in 2022. Back then, the economy and earnings were actually quite strong as the recovery from the pandemic continued. Real GDP grew 2.1% and S&P 500 revenue grew 11% for the year. Earnings growth for the full year 2022 was about 5%, following an incredible 47% growth in 2021. However, Fed policy became restrictive to fight the massive 9% spike in inflation. The Fed entered 2022 with rates at 0% – 0.25% and aggressively hiked it to 4.25% – 4.50% by December. Despite strong earnings and growth, the S&P 500 suffered a maximum drawdown of -25.4% and ended the year down -18.1%.
The lesson here: economic conditions and earnings growth rates can take a back seat to Federal Reserve policy, so it’s important to look at what the Fed may do in 2026 to get a better gauge for where the market may be headed.
So what’s in store for the Fed in 2026?
We know that Trump has clearly telegraphed that he wants the next Fed chairman to do his bidding and lower interest rates. It’s a situation that can create more problems than it solves, however.
Here’s why:
We are in a slowly unfolding situation where lowering short-term rates is actually driving long-term rates higher. In late 2024, when the Fed first cut rates in September, the 10-year Treasury yield was at 3.65%. By early 2025, after several more cuts to the Fed Funds rate, the 10-year yield had actually risen to 4.50%. Part of the problem was because inflation was still significantly above the Fed’s 2% target. In late 2024, Core CPI was still around 3.2%, and by late 2025, it was around 2.8%. Cutting rates while inflation is still above target and while the government is going into a deeper deficit is asking for trouble, and the bond market voted by causing longer term rates to move higher, despite the cut in short term rates.
In bond market terminology, this is called a “Bear Steepener,” and it occurs because the market demands a higher “term premium” to account for the inflation and deficit spending that rate cuts can trigger. As the Fed cut rates to 3.50% today, the 10-year has climbed back toward 4.20%, proving that the Fed no longer controls the long end of the curve.
The Erosion of Trust in Economic Data
Perhaps one of the most understated risks of 2026 is the growing suspicion surrounding official economic data. In August 2025, the firing of the Bureau of Labor Statistics (BLS) Commissioner Erika McEntarfer marked a turning point. For the first time, a career statistician was dismissed specifically because the President disagreed with the “disappointing” results of a jobs report.
Since that firing, we have seen a pattern where jobs and inflation numbers have suddenly “beat” expectations. When the government’s data can no longer be trusted, investors will begin to apply a higher discount rate to US assets. If the data is perceived as politically managed rather than objectively measured, the premium applied to US markets will begin to evaporate. This lack of transparency forces institutional investors to demand a higher risk premium, which naturally puts downward pressure on the market’s P/E multiples.
Circular Financing in the AI Ecosystem: A 1999 Replay
A big risk in the 2026 market is the return of vendor financing, a mechanic that mirrors the 2000 dotcom collapse. This occurs when hardware manufacturers provide the capital their customers need to buy their products, creating a self-reinforcing growth loop that lacks external cash flow.
In the late 1990s, hardware companies like Cisco, Lucent, and Nortel reached extraordinary growth rates by lending money to dotcom startups and telecom carriers such as Global Crossing and Qwest. These startups used the loaned cash to purchase Cisco routers and Lucent switches. The hardware giants booked this as revenue and growth, while the startups appeared to be scaling rapidly. The problem was that no real money was entering the system from actual paying customers; it was a leveraged circle. When the startups defaulted because their business models didn’t generate enough cash, Nortel’s $400 billion valuation went to zero and the sector collapsed.
The 2026 Parallel: Nvidia, Microsoft, and OpenAI (ChatGPT)
The exact same pattern has returned today. Nvidia and Microsoft are taking significant equity stakes in AI companies like OpenAI, the maker of ChatGPT, and CoreWeave (as of late 2025, Microsoft holds a 27% stake in OpenAI, while Nvidia holds a 7% stake in CoreWeave and has committed to a $6.3 billion investment deal).
These startups then turn around and sign multibillion-dollar contracts to buy Nvidia chips and rent Microsoft’s Azure cloud capacity. Microsoft’s Azure growth reached 40% in late 2025, driven largely by these partners. This creates an illusion of demand. If these AI companies do not generate massive, independent cash flow from actual users by late 2026, they will not be able to sustain the hardware orders.
Since the Magnificent 7 and AI-related tech now make up over 30% of the S&P 500, a breakdown in this circular financing would trigger a significant repricing of earnings estimates and P/E multiples for the entire index.
The Risk OpenAI Presents to the Market
Internal documents and 2025 disclosures show OpenAI has a target of over $100 billion in annual revenue by 2029.
To reach this from their $10-$12 billion run-rate in 2025, they must grow faster than any company in history. It took Google 10 years, Meta 7 years, and Amazon 8 years to go from $10 billion to $100 billion in revenue. OpenAI is attempting to do it in four.
In addition, OpenAI has already locked in $1.4 trillion in compute and hardware commitments through 2030 with Microsoft, Oracle, Nvidia, and Broadcom. They are projected to lose $14 billion to $16 billion in 2026 alone, with total losses projected at $44 billion through 2028. If OpenAI misses that $100 billion trajectory, the hardware giants will see their revenue numbers disappoint, similar to how Lucent and Nortel disappointed when the startups ran out of borrowed cash. You cannot finance your own sales indefinitely; eventually, an actual customer has to pay the bill.
Midterm Election Years: Choppiness Ahead
Historically, the 12 months leading up to a midterm election are some of the most difficult for the stock market. Since 1962, the S&P 500 has returned an average of just 0.3% in the year before the midterms, compared to its usual 8.1% historical average. Here’s how midterm election years look on the charts compared to the average year:
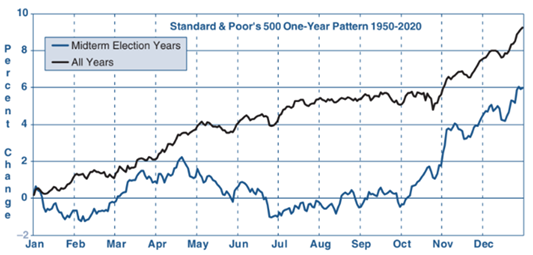 The reason for this aimlessness is simple: markets hate uncertainty. Until the polls close in November, the market doesn’t know what the legislative landscape or tax policy will look like for the following two years. History shows us that you often see a significant intra-year drawdown, averaging around -16%, in these years as the market waits for clarity. Then, once the election is done, regardless of the outcome, the elimination of policy uncertainty typically causes the market to rally through the end of the year.
The Potential Rotation and Warning Signal: The Value vs Growth Ratio
If the AI trade cracks, it’s likely that investors will flee to other sectors, similar to what happened after the 2000 tech peak. When the Nasdaq collapsed in the early 2000s, value stocks actually did quite well.
It’s no secret that the valuation gap between Growth and Value is pretty stretched. As of January 2026, Growth stocks trade at a forward P/E of 29.2x, while Value stocks sit at 16.1x. This gap is currently 2.1 standard deviations above the long-term mean; Value is cheaper relative to Growth than it has been 95% of the time over the last 30 years.
In addition to the AI trade potentially stumbling, one additional catalyst for this rotation is the shift in the profit picture for banks, a big part of the value index. For years, bank profits were hurt by an inverted yield curve, where short term interest rates were higher than longer term interest rates. In such a situation, banks paid more for deposits (short term rates) than they earned (longer term rates) on loans. In 2026, the engine has flipped due to the Bear Steepener mentioned above. While the Fed has cut short-term rates to the 3.50% – 3.75% range, long-term yields remain anchored above 4% due to deficit concerns.
This creates NIM (Net Interest Margin) expansion. Banks are rolling off trillions in low-yield pandemic-era loans and replacing them with new assets yielding 6.5% to 7.5%. And because bank fixed costs are stable, their high operating leverage means a 20 basis point expansion in NIM can trigger a 10% to 15% jump in net income.
Currently, the Financials sector trades at 14.5x forward earnings despite projected 15% earnings growth for 2026. While the Magnificent 7 are priced for perfection at 30x multiples, you can get similar double-digit growth in the boring banking sector for half the price. If the tech narrative breaks, the other 493 will have to pick up the slack, though given how much tech drives the market’s returns, it may not be enough to fully counter its effects.
If we were to poke holes in this Value argument, it’s worth noting that historically, Financials have often tended to trade at a significant discount to the S&P 500. Over the last 20 years, while the S&P 500 averaged a forward P/E of roughly 16x, the Financials sector usually hovered between 10x and 12x, so 14.5x is actually on the higher end for Financials. However, the reason the argument holds for 2026 isn’t because 14.5x is “cheap,” but because of the relative valuation gap and the expected further widening of the spread between short term and longer term interest rates.
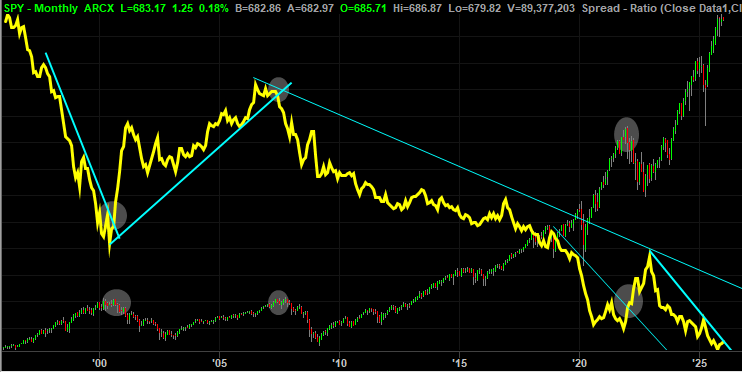
One other key to watch out for is the ratio of of value stocks to growth stocks. This is probably the most important voting mechanism of the market that I’m going to be paying attention to this year. When this value/growth ratio breaks out to the upside, historically, it has meant tough times ahead for the overall market. This is because over the past 30 years, we have largely lived in a growth-driven market. And when growth falters, value tends to hold up better, so the ratio tends to break out to the upside, which gives us a very important clue about the market’s health.
Tracking the upside breakout of the value/growth ratio gave us near perfect timing to avoid the collapse of the 2000 dotcom bubble and the bear market that unfolded in 2022. As of this writing, the ratio is right on the cusp of breaking out, so stay tuned.
Look Overseas for a Margin of Safety
Finally, we have to look at the rest of the world. For the last decade, diversifying outside the US has mostly meant lowering your returns because US tech outperformed everything else. In 2025, that trend finally changed.
 International markets, specifically Europe and Japan, are currently 35% to 40% cheaper than the US on a P/E basis. While the S&P 500 is trading at roughly 23x earnings, international indices are trading closer to 13x or 14x. These markets are less exposed to the AI vendor-financing risk and are more heavily weighted toward the value sectors, like banks, that benefit from a steepening yield curve. That was part of the reason European banks significantly outperformed the Magnificent 7 in 2025, and that trend could continue in 2026. Also, with the US dollar expected to weaken as the administration pushes for more competitive exports, holding international assets provides a currency tailwind that we haven’t seen in years. Most US investors are significantly underweight international equities. As a percentage of the global equity market, the US makes up about 64% while International makes up about 36%. It’s a good idea to reassess your weights and perhaps close that gap to get closer to market weight given the prevailing headwinds and tailwinds for US and International stocks.
Oh, and one last thing. Just as I was about to wrap this up, I came upon this magazine cover:
 Sigh. I exaggerate when I say this, but this may be the final nail in the coffin.
There’s a well known effect in the stock market called the “Magazine Cover Indicator,” which is a theory pioneered by Paul Macrae Montgomery that suggests that by the time a trend or person reaches the cover of a mainstream, non-business publication like Time, the narrative has reached its “point of maximum recognition.” At this stage, everyone who was going to buy into the story has already done so, leaving no marginal buyers to push the price higher.
Here are a couple examples:
1. “The Death of Equities” (BusinessWeek) – Aug 1979 – After 10 years of stagnation and high inflation, the cover proclaimed stocks were dead. This marked the exact bottom before the greatest 20-year bull market in history.
2. “Person of the Year: Jeff Bezos” (Time) – Dec 1999 – Amazon and the Dotcom boom were at their absolute peak. Within three months, the Dotcom bubble burst. Amazon stock eventually dropped 95%.
3. “The End of the Oil Age” (The Economist) – Oct 2003 – Oil was at $25. The cover predicted a permanent decline in demand/prices. Oil immediately began a historic climb, reaching $147 by 2008.
4. “The Committee to Save the World” (Time) – Feb 1999 – Celebrating Greenspan, Rubin, and Summers for managing the global economy. A year later, the tech bubble collapsed, and their “management” was widely criticized for fueling the fire.
5. “Elon Musk: Person of the Year” (Time) – Dec 2021 – Tesla had just hit a $1 trillion valuation; Musk was the world’s richest man. Tesla stock peaked almost exactly then and fell over 65% in the following 12 months.
Some studies have actually backed this observation. A 2016 study by Citigroup analysts Gregory Marks and Brent Donnelly examined 25 years of The Economist covers and found that they acted as a reverse indicator 68% of the time after one year. Specifically, they found that shorting assets on “optimistic” covers would have generated an 8% return, while buying “pessimistic” covers returned an average of 18%. Similarly, a study from the University of Richmond analyzed 20 years of data from BusinessWeek, Fortune, and Forbes, concluding that companies featured in positive cover stories saw their stock performance peak almost immediately after publication, underperforming significantly over the following 500 days.
This is why the “Architects of AI” cover is so significant. It satisfies all three of Montgomery’s classic rules: it’s a mainstream publication, it features a concept (AI) reaching a climax, and it follows a multi-year period of massive asset-price gains. Historically, when the masses are finally sold on an idea, that’s when things turn south.
So to conclude, the road to 10% gains in the stock market is paved with a lot of potential issues that need to be carefully navigated in order to become a reality. Potentially higher long term yields, questionable economic data, disappointment in the AI ecosystem, peak AI enthusiasm, and midterm election year uncertainty point to a lot of choppiness, a potential compression in tech valuations, and a rotation into value and international stocks. If there’s ever a year for a good old fashioned 15% drawdown, a potential rotational year like 2026 is as good as a setup gets.
Having hedges will make a lot of sense and will help smooth a potentially bumpy ride in 2026.