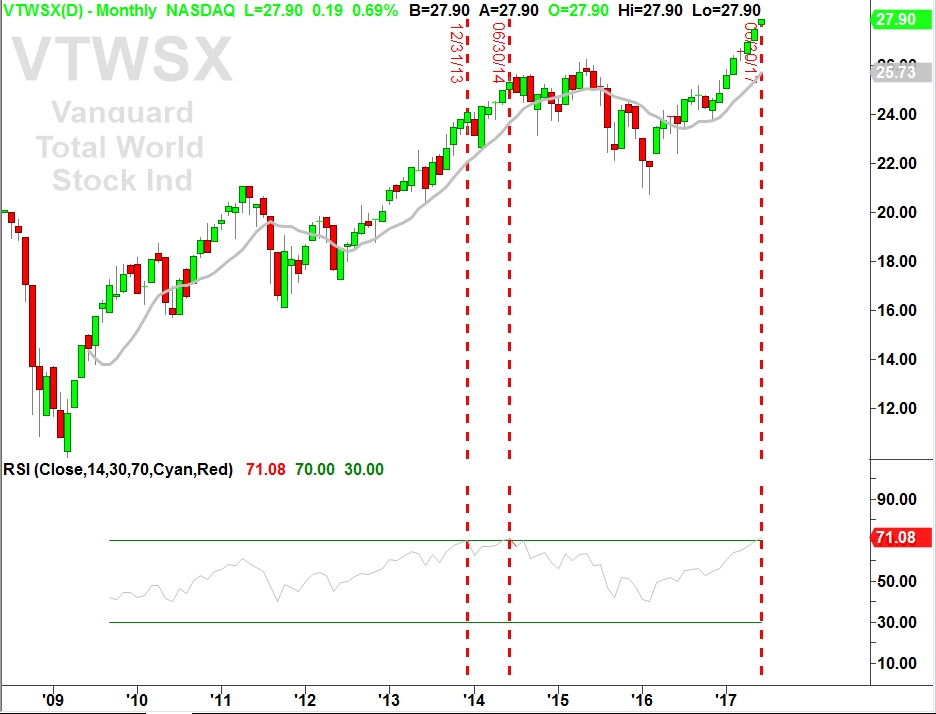
Markets have continued to “melt-up” since the election, and it seems like nothing can stop it. In fact, according to a measure called RSI, an indicator that tries to identify points where markets are too stretched in either direction, world stock markets recently hit that mark for the first time since 2014 on the monthly charts, which is more significant than the weekly charts shown in a previous post:
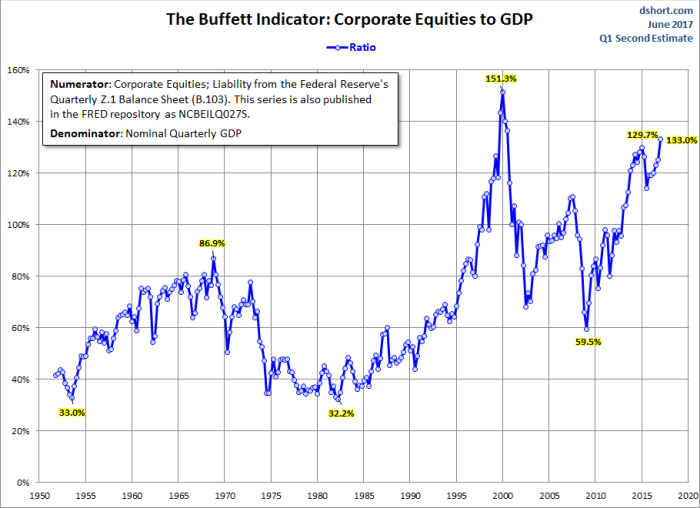
As for valuations, the conventional thinking is that the combined value of all the stocks in the US generally shouldn’t exceed the total value of its GDP. This relationship has held since the last century. But due to extraordinary measures being taking to suppress interest rates by the Federal Reserve and the enthusiasm for the stock market, the value of all the stocks in the US is now at 133% of GDP. Here is a look at how lofty valuations have become. Based on historical trends, we are about 41% above where stocks would normally trade, which is why playing defense in this environment is prudent:
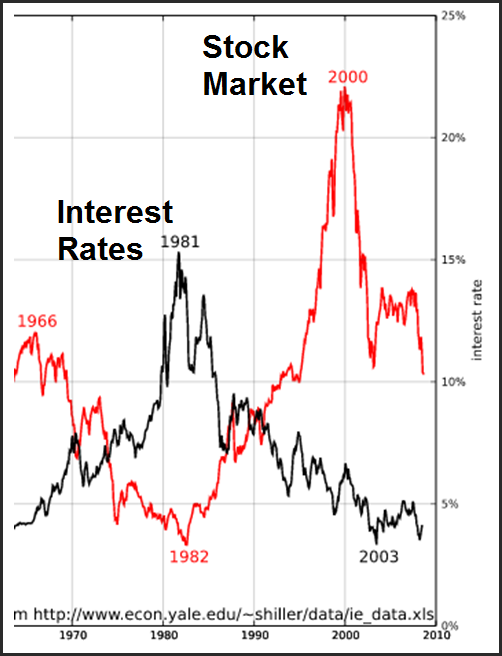
The Federal Reserve is now trying to gradually reverse its low interest rate policy, and they have now raised interest rates 4 times since December 2015. A historical relationship has existed that shows higher interest rates have tended to result in lower stock market valuations (P/E multiples tend to contract), which has further added to our reasoning for playing more defense, since valuations are high:
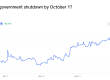
What’s particularly interesting about the timing for all of this is that George Vrba recently posted on Seeking Alpha that his long-leading recession indicator just gave the first warning sign for a potential recession in the U.S. starting within a very wide window of October 2017 to May 2019. The indicator gives warning signals when it falls below zero, and if you look at its historical performance, it does have a pretty good ability to forecast recessions (the grey shaded areas):

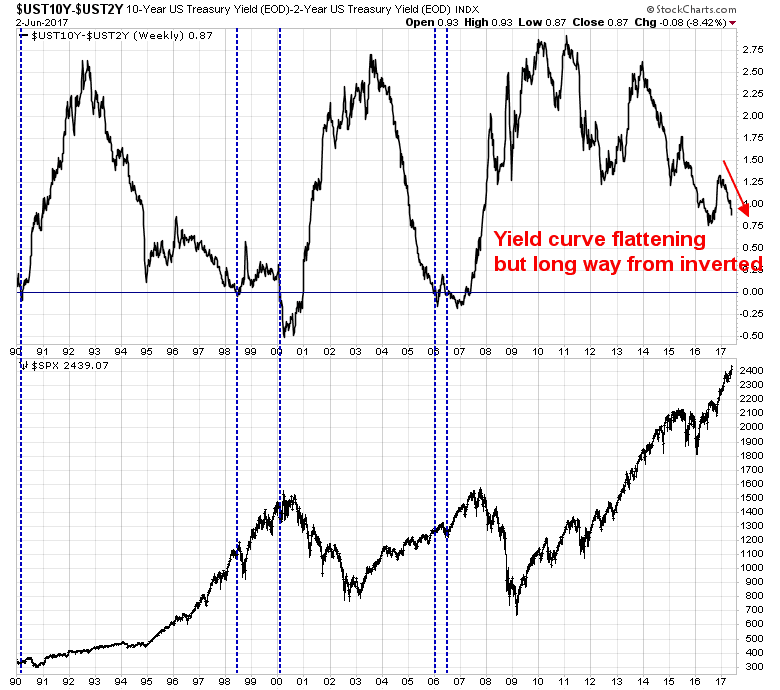
This is just a yellow flag, for now, but a very important one. It’s also important to look at how the bond market is viewing the economy. A great indicator to look for is something called an “inverted yield curve,” which is what happens when longer term interest rates fall below shorter term interest rates. This inverted yield curve indicator has accurately predicted 7 out of the past 7 recessions, for a perfect track record. Inverted yield curves are bad because banks depend on shorter term rates to be lower than long term rates. They capture deposits and pay out interest based on the short term rate, while lending out at interest rates tied to the long term rate. If the long term rate falls below the short term rate, banks can’t make money and therefore cut back on lending, which can cause the economy to contract.
Cam Hui, CFA provides us with a graph that shows we are still not at the point of inversion, but we are headed in that direction:
The most important indicator I follow is the jobs growth figure from the Bureau of Labor Statistics. As long as jobs growth is positive, the band can still continue to play at this party. This figure is still currently positive, though it is gradually softening:

Now what happens when we start LOSING JOBS and go into a recession? That’s when we’ve historically seen things change for the worse for the stock market. It’s the one constant factor that coincided with peaks in the stock market during the dotcom bubble and the housing bubble.
When that happens, that’s when it has made sense to play defense and reduce exposure to stocks.
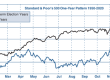
But what should you play defense with? Here’s a quick look at what investors have used to play defense, and how it behaved during all of 2008 and the two worst months of the financial crisis, September and October.

You can see that in the span of two months, the market dropped about 25%. Gold, which a lot of people consider to be a safe haven, surprisingly was a poor source of protection, as it DROPPED about 12%. And CORPORATE BONDS, did just as poorly, which makes sense, because as earnings were falling, companies’ abilities to pay their debts got pressured.
There was a little less damage from municipal bonds, but where things really shined was US TREASURY BONDS, which held steady during the crisis and beat the market by about 55% to 70% that year, depending on how long the maturities were that you bought.
US Treasury bonds are considered the safest assets to be in during times of panic, and there’s a good chance it will be able to provide positive returns in falling markets, especially during periods of economic weakness.
Because of that, it’s a good idea to consider having US Treasury bonds in your portfolio as a way to play defense.
Rainier Trinidad, CFA
San Diego and Coronado’s Fiduciary Financial Advisor
Parabolic Asset Management
206 J Avenue
Coronado, CA 92118
rainier@parabolic.us
(619) 888-4070
Investment Risk Disclaimers: (i) Investments involve risk and are not guaranteed to appreciate, and (ii) Past performance is no guarantee of future results.